One could make a case that spreadsheets are the oldest form of writing, if some of the earliest examples of writing are columns of cuneiform symbols pressed into clay with reeds to keep track of how many cattle or pots got shipped up and down the river. Back then, stories were oral, but written records made tracking your business's assets and activities a lot easier. Spreadsheets were certainly the killer app of the original personal computers, as people bought 8-bit PCs to run Dan Bricklin's VisiCalc (not Dan Brickley's) and then the 16-bit IBM PC to run Lotus 123. Whether creating a phone list for a kid's soccer team or modeling complex financial derivatives, people tracking data that fits into a table of rows and columns like to put it into spreadsheets.
A SPARQL query returns a table of results in XML or JSON, formats that you can easily convert into other formats. One of my most popular blog postings describes how implementing a download as spreadsheet link is as simple as creating an HTML table and then telling the downloading browser "here comes a spreadsheet" before delivering that HTML. The browser will usually open up the designated spreadsheet application and load the table there, including simple formatting included with the data.
To do this with for SPARQL queries, I created a form at http://www.snee.com/sparql/spreadsheetSPARQL.html with an appearance based on SNORQL forms such as DBpedia's. The form has two fields: one for the URL of a SPARQL endpoint and one for the SPARQL query to send to that endpoint. Clicking the "Go" button tells a python CGI script to do the following:
Send the query to the endpoint, asking for a JSON version of the results.
Send an HTTP Content-type value of "application/vnd.ms-excel" to the application that requested the SPARQL data (most likely, the browser displaying the query form).
Send an HTML version of the JSON data to the requesting application.
A computer that doesn't have Excel installed will open whatever application is assigned to open Excel spreadsheets; my Ubuntu laptop displayed the table in OpenOffice Calc. It all worked fine from Firebird on Ubuntu and Windows and from Internet Explorer (but not from Google Chrome, which just downloaded the result to a file).
There are many SPARQL endpoints that have apparently worked at one time or another, but only four worked when I tested my spreadsheetSPARQL form and script. Still, the fact that four worked fine was great, and the Linked Movie Database in particular will be a lot of fun to play with. The spreadsheetSPARQL form lists the endpoints that worked for me. It also links to a recent posting I did on good queries to start with when exploring an unfamiliar set of RDF data.
Here's one example of using the form. I sent the following query to DBpedia's SPARQL endpoint of http://dbpedia.org/sparql:
SELECT ?co,  ?revenue, ?netIncome
WHERE {
  ?co dbpedia2:revenue ?revenue;
      dbpedia2:netIncome ?netIncome.
  FILTER (?revenue > 80000000000)
}
ORDER BY ?revenue
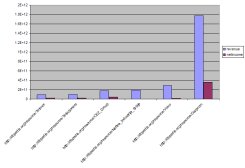
I downloaded the result into a spreadsheet and then created the bar graph shown above. (Gazprom's revenue for last year pretty much dwarfs all other figures, but the current drop in oil prices should even out next year's version of the graph.)
There is tons more data on DBpedia alone that will be interesting in a spreadsheet, and the number of additional SPARQL endpoints to pull data from is growing. Please let me know if you create other interesting spreadsheet uses of SPARQL data, with graphs or otherwise. I look forward to hearing about them.


So far you've motivated seeing the results of a query in a table and making a graph from them. I'd like to have both of those capabilities in a webapp. E.g. I should be able to embed a live graph in my own page like this:
<img src="http://sparqlgrapher.com/svg/example.com/query=SELECT+?date+?price+{...}">
Visiting my hypothetical sparqlgrapher.com directly would give you a UI to layout and customize the graph. When you're done, you'd take that url and embed it elsewhere (or just take a copy of the image, if you want a one-off).